

In a world of visual stimuli, infographics attempt to communicate what text alone cannot. Infographics turn data into digestible pieces of informational art. They have the power to synthesize knowledge and insight, to clarify, persuade, and educate the viewer.
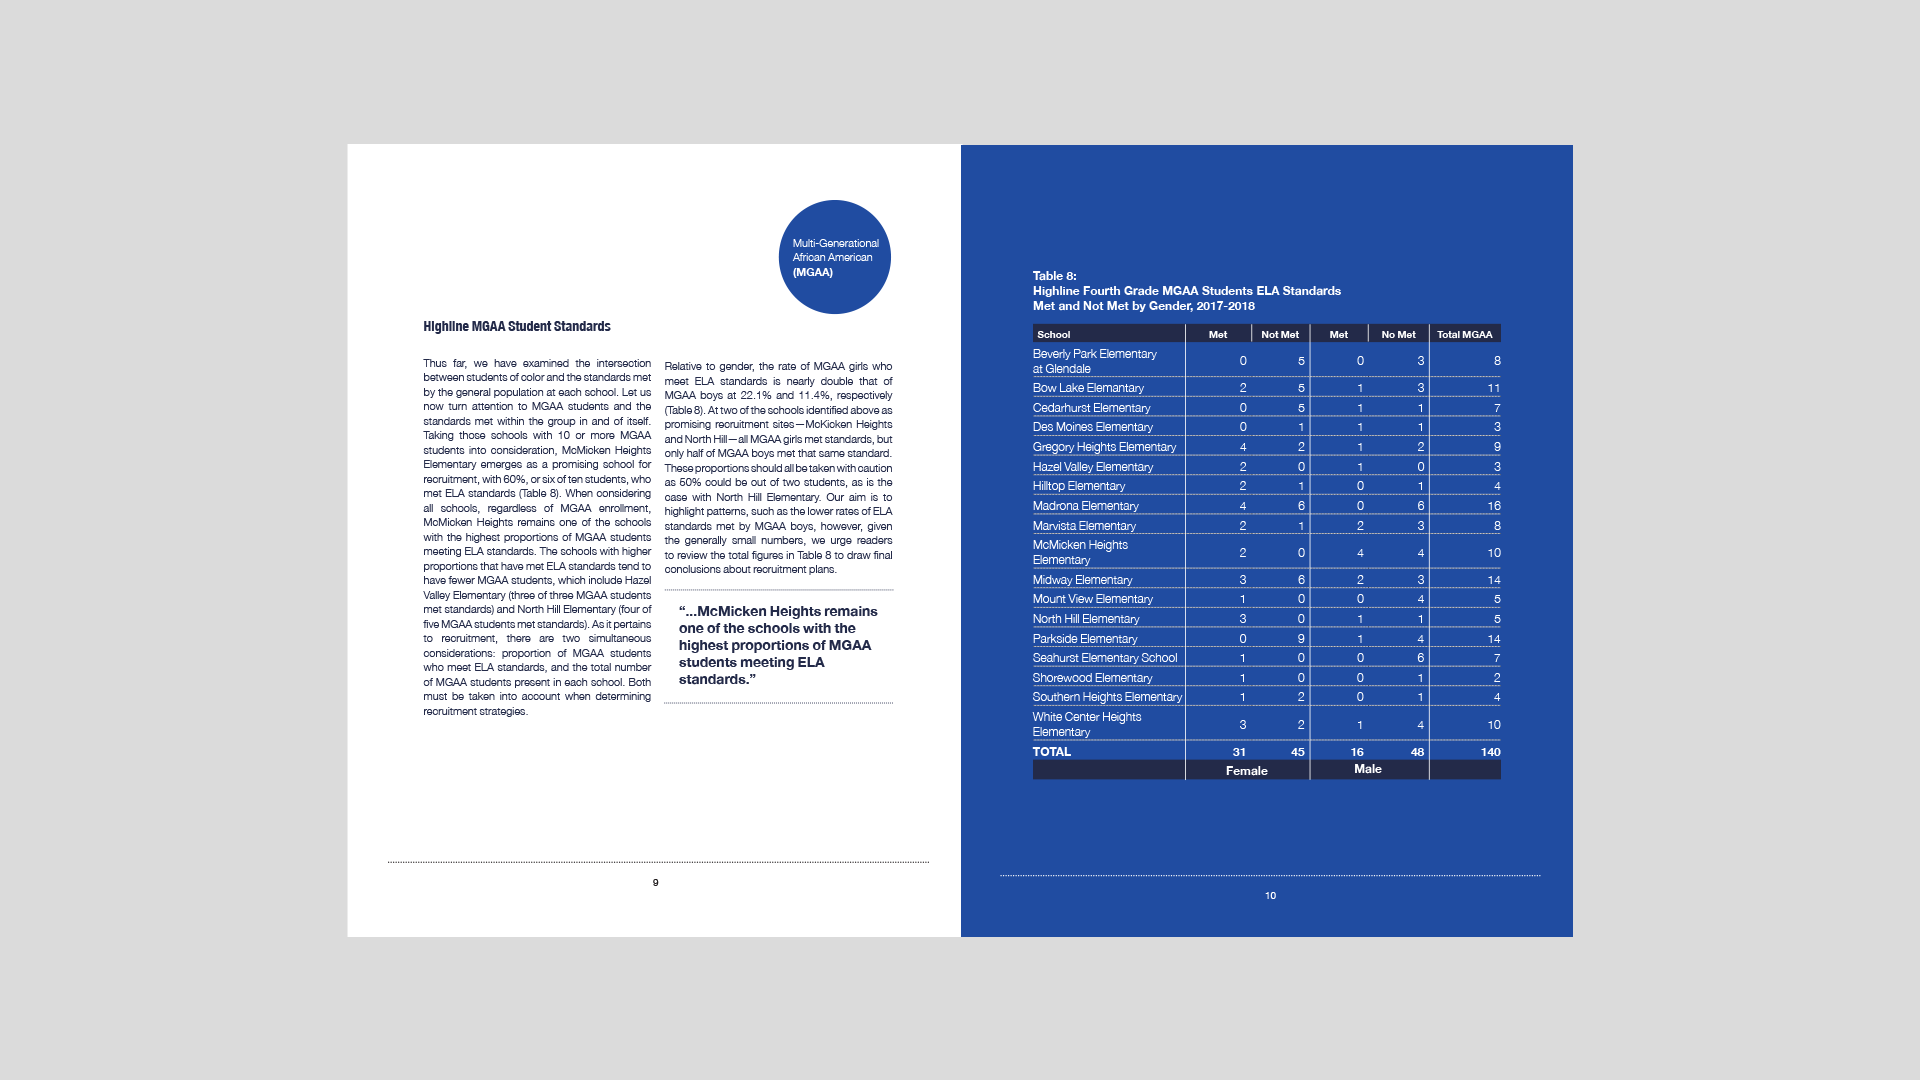
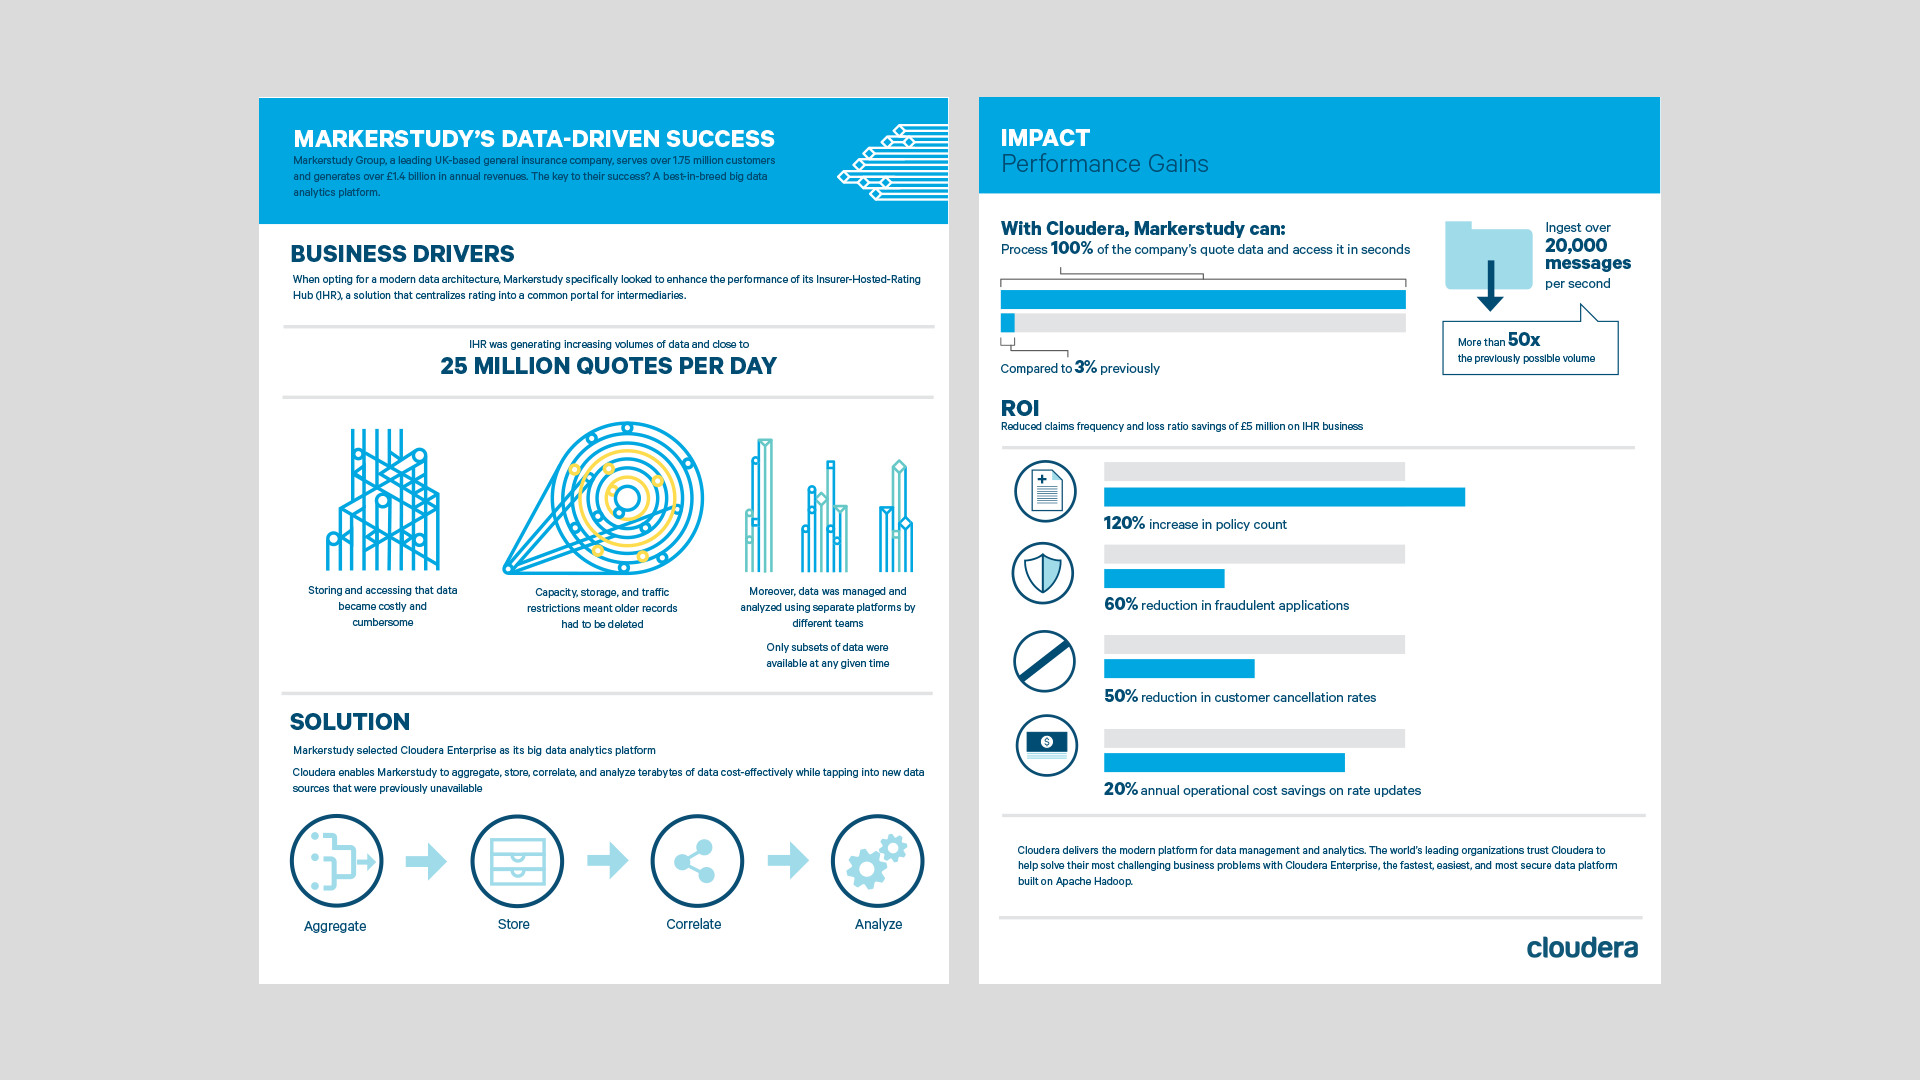
Data was used in charts for financial information and and to accompany reports while working at the ACLU and freelancing. Some samples are versions that were scrapped or reconfigured in their final form.
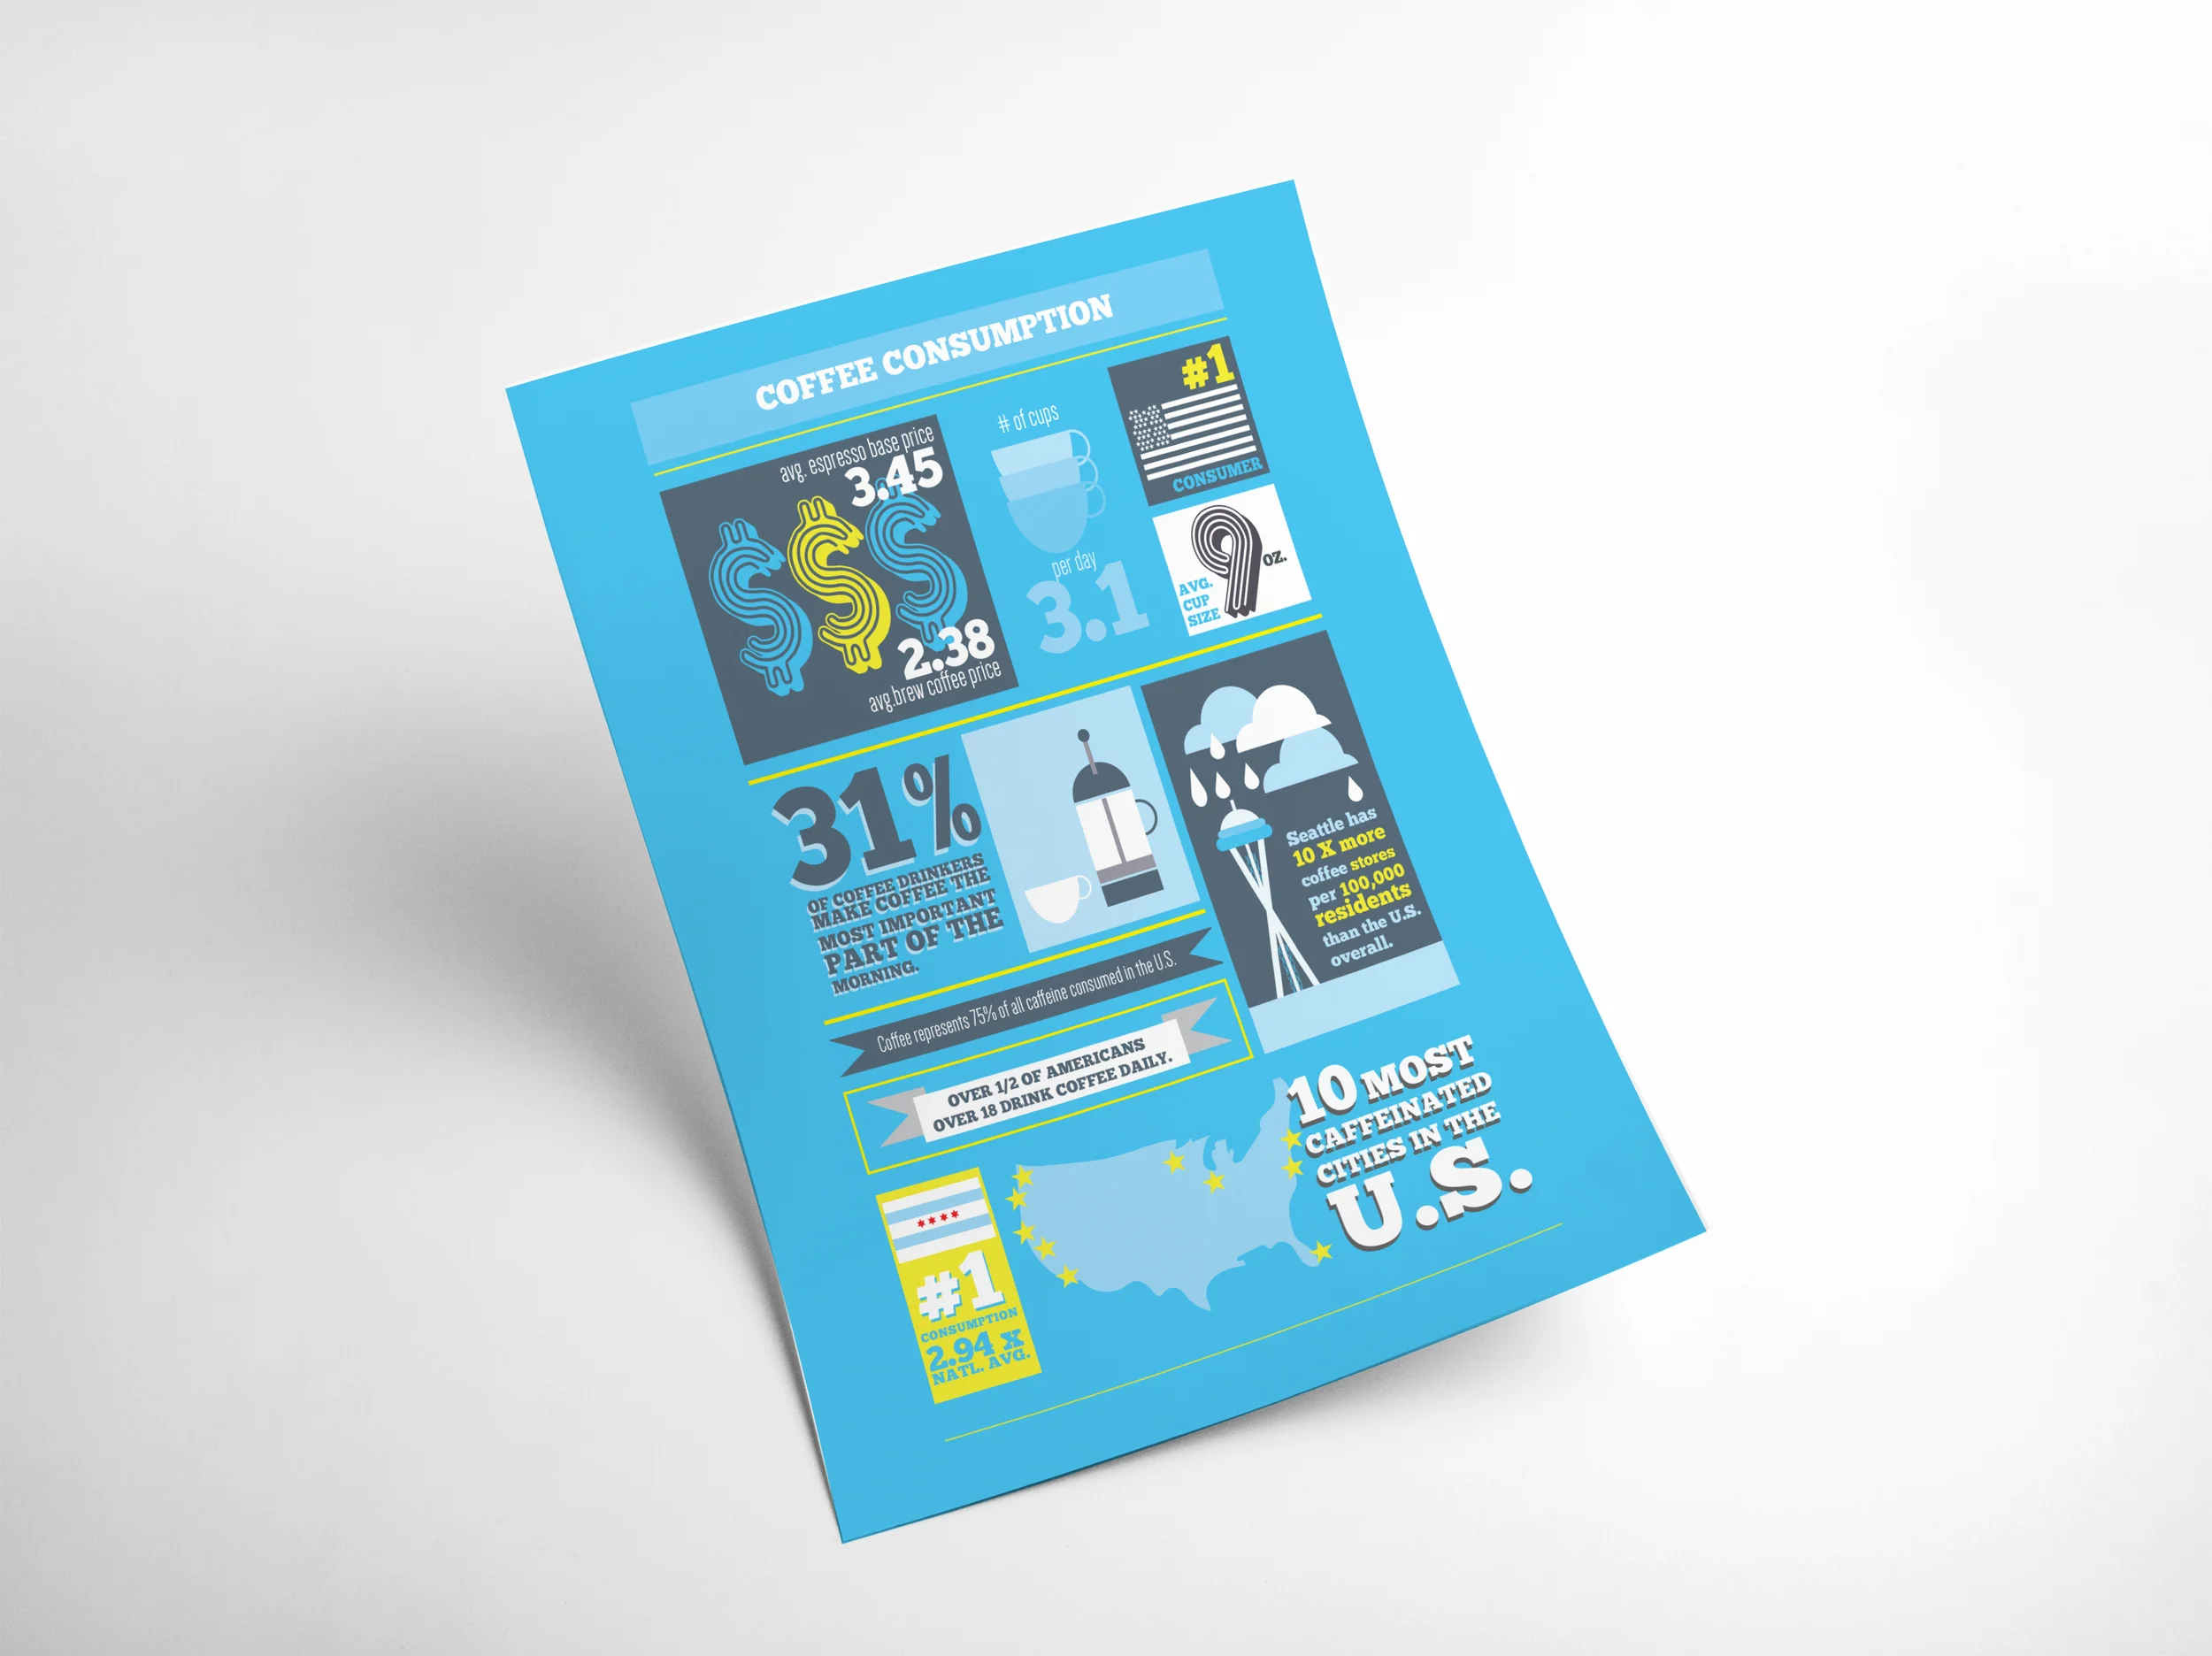
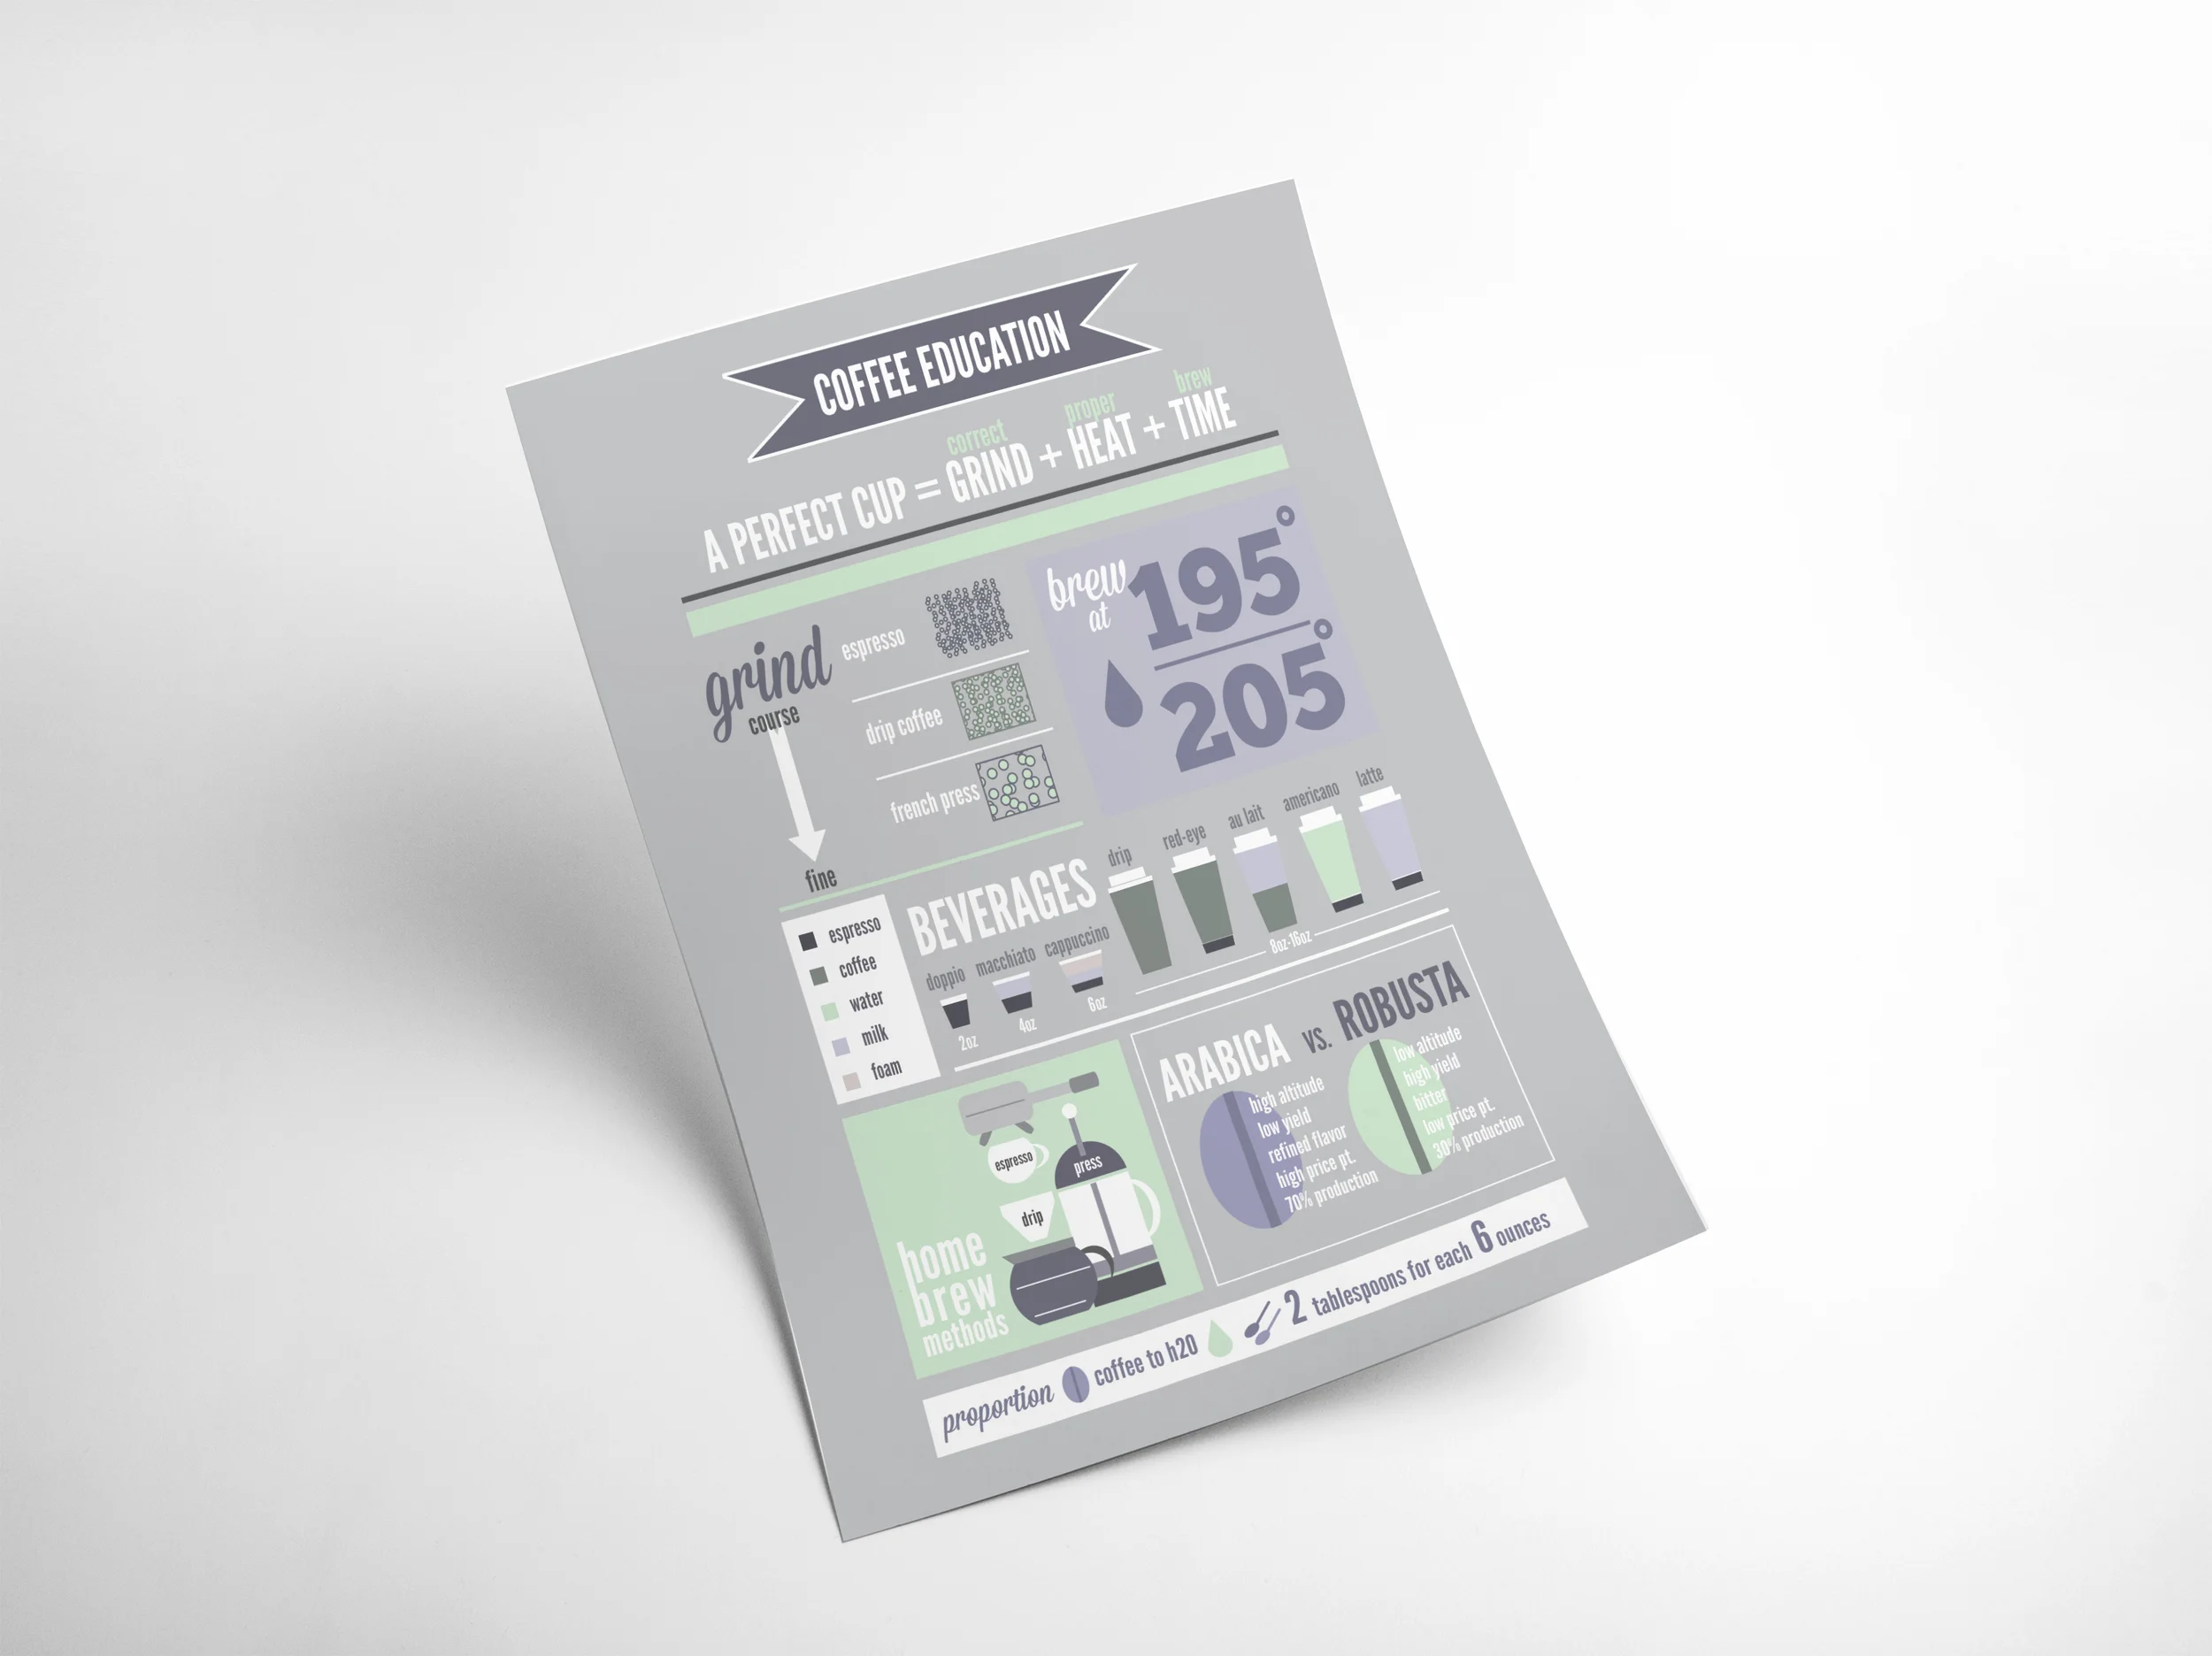
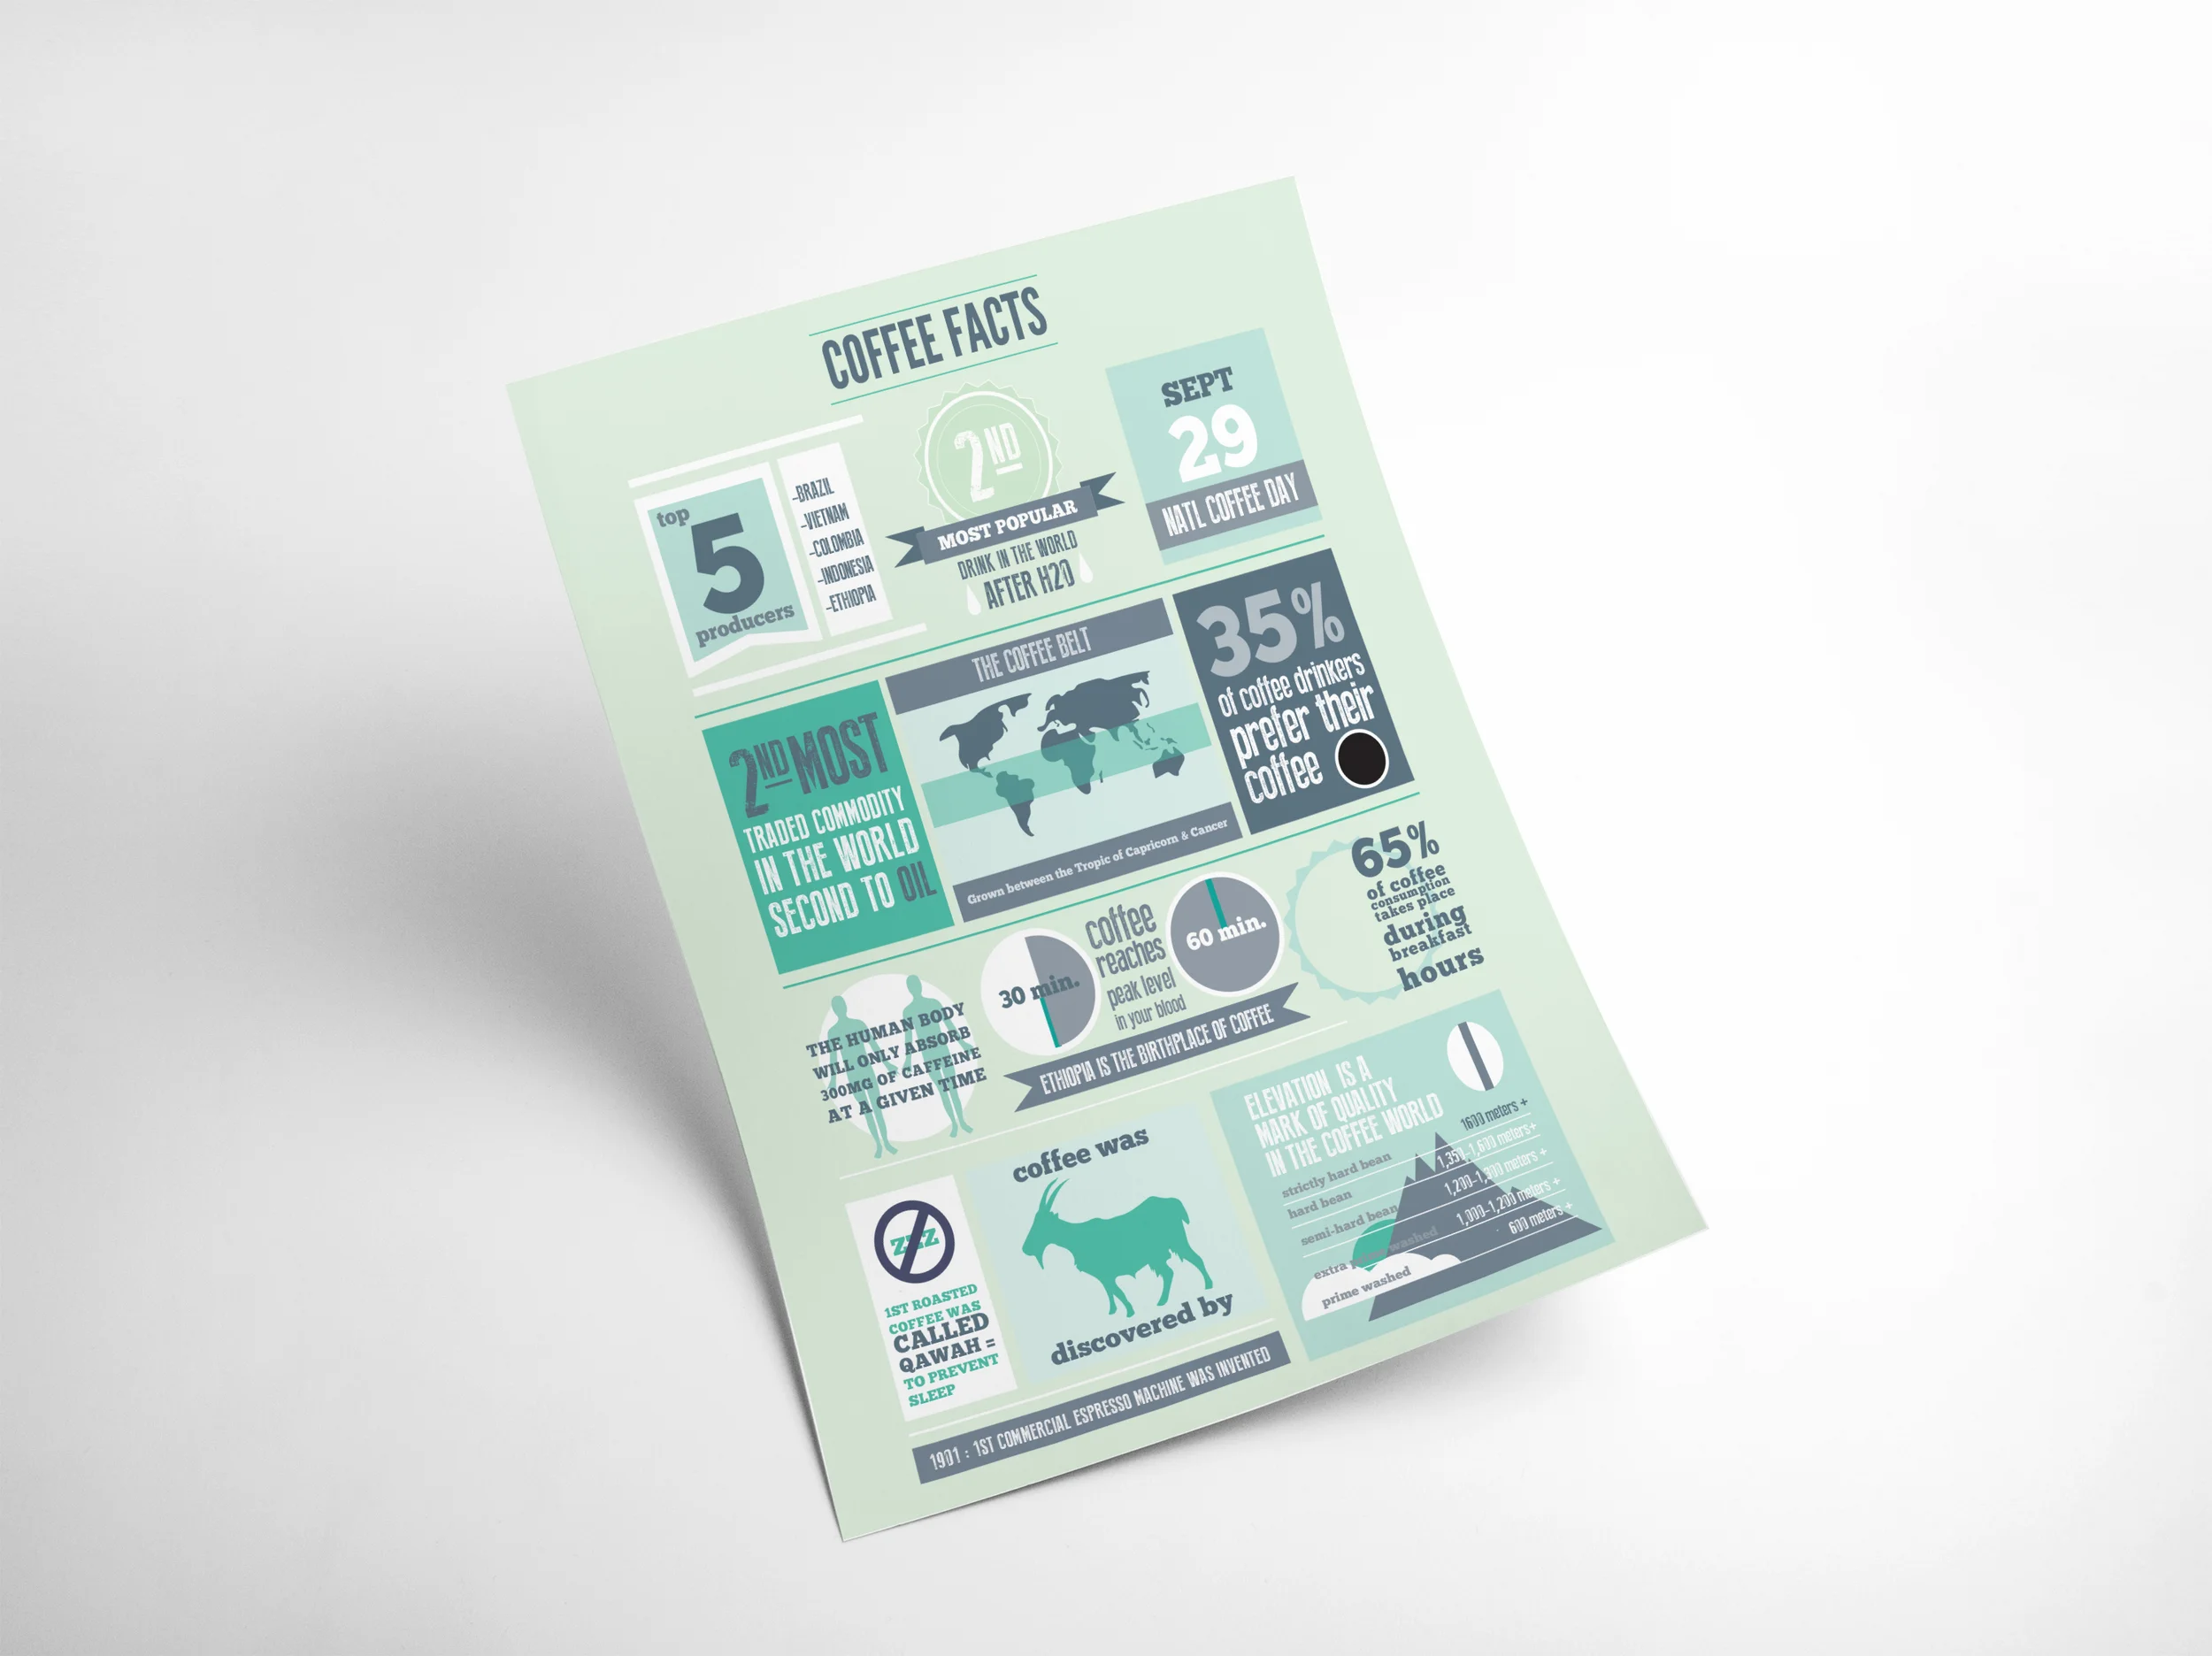
For 9 Bars Magazine, infographics were created to explain processes about coffee in a clear and concise way.